
On Detection: Tactical to Functional
Part 9: Perception vs. Conception
The concepts discussed in this post are related to those discussed in the 9th session of the DCP Live podcast. If you find this information interesting, I highly recommend checking the session out!

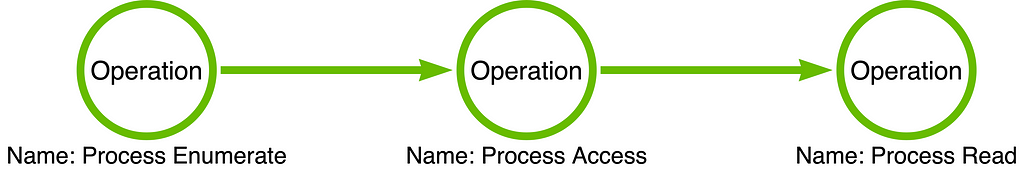
At this point in the series, we understand that attack techniques are abstract concepts that must be instantiated in the form of a tool or software application. We also understand that there are many abstraction layers that exist between the (sub-)technique, OS Credential Dumping: LSASS Memory, and the Mimikatz tool. Over the past few posts in this series, we’ve explored these layers–specifically the functional and operational layer. For instance, below, we see the “operation chain” or “procedure” that corresponds with mimikatz’ sekurlsa::logonPasswords command. Here we see that the operations that form the chain are Process Enumerate -> Process Access -> Process Read.
In this article, I hope to demonstrate how the operational layer IS the appropriate layer of analysis for those interested in creating behavioral detection analytics.
Note: In this context, a behavioral detection analytic is one that focuses on what the malware does instead of what the malware is. It decouples the action from the actor. This is not to say that detecting known bad malware based on what it is, is a bad idea; we simply are attempting to take the next logical step.
Snake Detection Theory
In her 2009 book, “The Fruit, the Tree, and the Serpent”, Lynne Isbell explores her idea that human visual perception developed as a result of the relationship between our ancestors and snakes. The general proposal is that until relatively recently, humans lived with snakes as their primary predator which meant that “snake detection” served as a selective pressure on our sensorial development. If a human was unable to identify a snake, then they were likely to succumb to predation and therefore less likely to reproduce. This meant that over time, our visual perception developed to be more attuned to detecting snakes which in general is not an easy task. You see, snakes slither along the ground, often in tall brush, and are camouflaged to their environment. Isbell proposes that to adapt to this fact, human visual perception eventually became more sensitive to objects in motion instead of static objects. The proposal is that selection worked to ensure that modern humans see that which they need to see to survive. There is simply too much signal out there in the world for us to attend to it all, so we must prioritize the signal that is most likely to be important. This is why we use the phrase “to pay attention.” The idea is that attention is a finite resource that we must spend judiciously; ultimately, the process of attending is done subconsciously.

While this presumably works well in the biological world, it is not obvious that this same principle applies in the cyber realm. Our perception in the cyber world is artificial or man-made, so to assume that it is properly adapted via selection may be a large leap. A question worth asking is whether you believe that feedback is produced in an efficient enough manner to hone our perceptual capability in cyberspace. If the endpoint detection and response (EDR) sensor serves as the functional equivalent to our eyes in this space, how do we know that it is prioritizing those events that are most relevant to our ability to detect?
In this article, I hope to link our conceptual model, the operation chain, to our ability to perceive EDR events. We will explore how the operation chain provides a formula for predicting the types of events one should expect to encounter as a result of executing a specific sample or operation chain. We will also compare and contrast two EDR solutions to understand the difference in their ability to perceive certain operations. Most importantly, we will demonstrate that we perceive operations.
The events that we collect are synonymous with operations. This means that until we are able to prove otherwise, the optimal level of analysis for malware samples, within the abstraction, is the operational level. I’ve been using the phrase “align your conception to your perception” to help our team understand how to think about attacker behaviors. In this phrase, “conception” signifies the model with which you think about the behavior and “perception” signifies the events that you use to understand the activity in your environment. If these two concepts are not aligned, then you are starting with a disadvantage.
Let’s dig into it!
We perceive operations
A good detection engineer should understand how they perceive their cyber environment. Human beings exist in a biological environment and have hardware (sensory organs like eyes, ears, skin, etc.) that allows them to receive signals from the environment in order to perceive it. Even though humans have five senses, meaning they have the ability to perceive five different types of signals, we know that there are signals that exist in the world that we cannot naturally perceive. For example, we know that sharks have the ability to perceive electrical currents through a sense called electroreception. Unfortunately, our biological senses do not provide any natural perceptual value in the artificial cyber environment. As a result, we have built sensors that capture signals and convert them in a way that we can ingest and process. Over time, these sensors have evolved, so to speak, and become more complex. So what do we use as our eyes and ears in the cyber environment? The answer is simple, we use hardware and software sensors like EDR agents and network monitoring sensors to capture signals from the environment and present them to us in a manner that we can consume. Since EDR is a significant source of the telemetry used in detection engineering, I want to focus on discussing how and what exactly EDR sensors see.
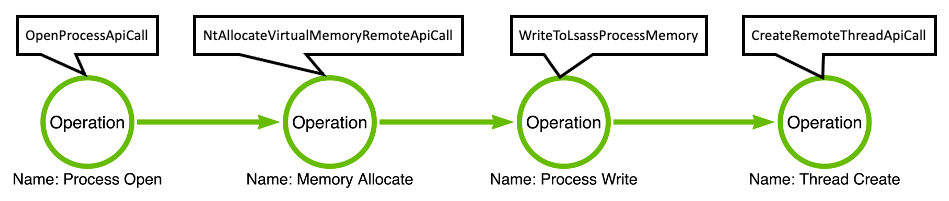
To answer this question, I think it is valuable to dig into some events from multiple EDRs just to demonstrate why I am making the claim that what we see, in the form of events, are in fact operations being carried out. Below is a sequence of operations (i.e., operation chain) that describes classic remote thread injection. We see that the operation chain is composed of four operations, each of which will be discussed in more detail below:
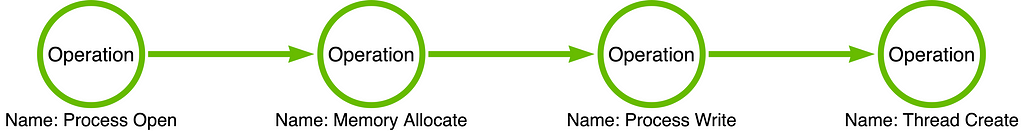
Process Open
The first operation that we see is Process Open. Processes are securable objects on the Windows OS and their structure lives in the kernel. This means that user-mode applications do not have free reign to interact with them directly. Instead, the requesting application (the malware, in this case) must open a handle which can then be used to interact in many different ways with the process. The opening of the handle is the point at which the access checks occur based on the requesting process’s token and the target process’s discretionary access control list (DACL). If the access check fails, the requestor will receive an ACCESS_DENIED error in response.
Memory Allocate
Once the process handle has been obtained, it is necessary to allocate a buffer of memory in the remote process which will be used to hold the injected shellcode. This operation depends on the handle that the Process Open operation produced. Specifically, the handle must be opened with the PROCESS_VM_OPERATION access right. This step is necessary because the source (injecting) process must make the code available in a location that is accessible to the target (injected) process.
Process Write
After a buffer has been allocated in the target process, the malicious shellcode can be written to that buffer. Again, the process handle the Process Open operation produced is used; however,in this case, the PROCESS_VM_WRITE access right is required. The Process Write operation is the component of the operation chain that causes this to be considered “injection.” Once the code has been written to the target process’s memory space, the final step will be to find a way to coerce the target process to execute the code.
Thread Create
The final operation is focused on executing the injected code. The traditional way of executing the code is to create a new thread that is set to execute the code located in the buffer that was allocated during the Memory Allocate operation. Over the years, there have been many alternative execution mechanisms discovered, but for the sake of simplicity we will stick with the Thread Create operation for this article.
Associating EDR Events with the Operation Chain
Once the operation chain has been established, Detection Engineers have the information they need to begin considering the practical components of the detection. Specifically, the operation chain provides the details they require to identify the events or logs that are relevant to the behavior in question. In this section, we will explore the relevant events that two common EDR platforms generate and demonstrate that the events that we collect are focused on the operational level. This means that if you can identify the operations that a malware sample implements, then you can likely correlate them to the telemetry that your EDR platform captures. This facilitates deliberate detection engineering.
Note: It is important to note that there are many unique operation chains that implement the Process Injection technique. In this article, we are focusing on one operation chain which is considered the prototype for this technique. I’ve found that, similar to the way we teach complicated topics such as mathematics, it is ideal to first teach detection engineers to build detections for single operation chains. Once they are comfortable engineering detections for single operation chains, then they can begin to consider the ramifications of multi-chain detection engineering. If, however, they lack the single-chain fundamentals, they will inevitably struggle to find valid solutions for multiple chains.
Microsoft Defender for Endpoint (MDE)
Now imagine that you work for an organization that uses Microsoft Defender for Endpoint (MDE) as your EDR. If I asked you which MDE events are available for this particular operation chain, you might have a number of different options that immediately come to mind. In fact, I chose MDE specifically because it produces an event for each operation in this chain which I think precisely demonstrates the point of this article. The general rule of thumb that I hope to demonstrate is that EDR products perceive operations. Let’s take a look at each operation and consider which MDE events report on them.
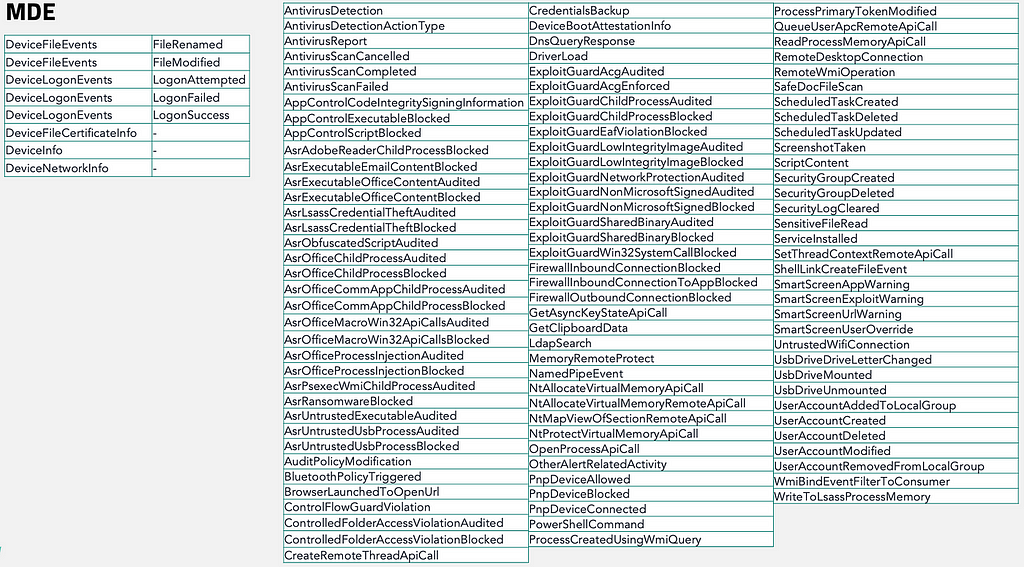
The first step in correlating MDE events to operations is to become familiar with the types of events that are available to you. To begin, I recommend referencing Microsoft’s data table documentation. While there are many supplementary tables available in MDE, I find that the tables shown in the screenshot below are the primary tables that I use as the foundation of my detection engineering efforts.
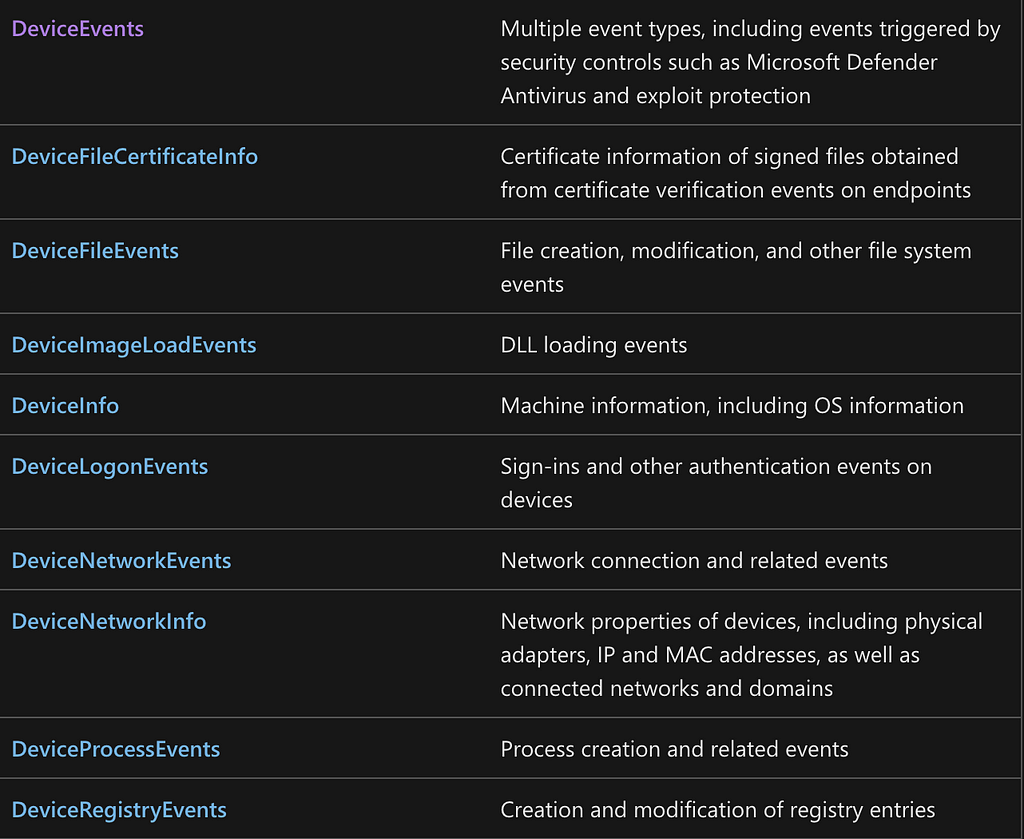
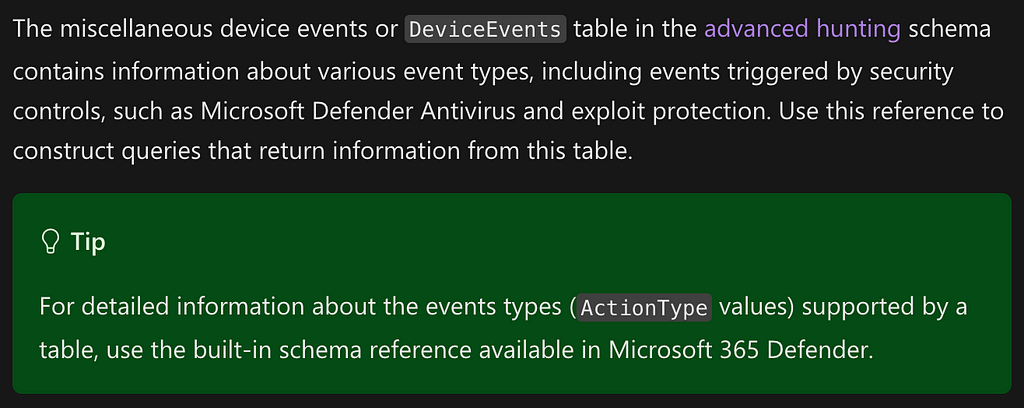
After analyzing this list, you might be thinking, “I don’t see anything related to Process Open, Memory Allocate, Process Write, or Thread Create,” and you would be entirely correct. The trick here is that the DeviceEvents table hides a treasure trove of events, so the next step is to dig into it. When we browse to the documentation page for the DeviceEvents table, we find that the ActionType column is the key to discovering all of the different event types that exist within the table. Notice the “Tip” callout where it recommends the use of the built-in schema reference in MDE in order to discover the supported ActionType values. If your organization uses or has access to MDE, I highly recommend you spend some time doing just that.
However, if you do not have access to MDE, then we will do this exploration artificially. In his blog post where he compares the telemetry generation capabilities of Sysmon to those of MDE, Olaf Hartong provides this great spreadsheet that contains all of the action types that were available at the time of his post (October 2021). The list has likely grown over the subsequent years, but is sufficient for the purposes of this article. We will use this list to correlate ActionType values to the relevant operations from our chain.
Process Open -> OpenProcessApiCall
As described earlier in this post, the Process Open operation is the first operation in the chain. When we reference Olaf’s list of ActionType values available within the DeviceEvents table, we see one ActionType that stands out. The OpenProcessApiCall ActionType, named after the OpenProcess API function, reports Process Open events. It is important to understand that despite the ActionType’s name being related to a specific API function, the event itself is generated in the kernel and thus is resilient to functional changes. This means that regardless of whether the kernel32!OpenProcess, kernelbase!OpenProcess, ntdll!NtOpenProcess, or syscall!NtOpenProcess functions are called, the event will generate. For more information regarding how this event is generated in the kernel, I recommend checking out Jonathan Johnson’s excellent blog post on the topic.
Below is an example Kusto query to find these events:
DeviceEvents |
where ActionType == "OpenProcessApiCall"
Note: MDE in particular implements some amount of filtering on this event. While the actual Event Tracing for Windows (ETW) provider captures all Process Opens, MDE will only forward the events where lsass.exe is the target process. While this decision does not impact some techniques, such as OS Credential Dumping: LSASS Memory, it would severely impact its utility with regard to Process Injection as the target process is not guaranteed to be lsass.exe.
Memory Allocate -> NtAllocateVirtualMemoryRemoteApiCall
Following a similar process, we find that there are two relevant ActionTypes for the Memory Allocate operation: NtAllocateVirtualMemoryApiCall and NtAllocateVirtualMemoryRemoteApiCall. Again, despite the name being focused on a specific function name, these events are generated in the kernel and thus capture all user-mode functions in the Memory Allocate function call stack. Jonathan Johnson again helps us out with his fantastic TelemetrySource project, where he explicitly maps how these events are generated via the Microsoft-Windows-Thread-Intelligence ETW provider.
Our next question is whether both events are relevant to our specific use case. What we find is that the first event, NtAllocateVirtualMemoryApiCall, is generated when memory is allocated locally (within the calling process); while the second event, NtAllocateVirtualMemoryRemoteApiCall, is generated when the memory allocation is done in a remote process. Since we are focused specifically on Process Injection, meaning the injection is occurring in a remote process, we can safely say that we are only interested in the NtAllocateVirtualMemoryRemoteApiCall version of the event.
DeviceEvents |
where ActionType == "NtAllocateVirtualMemoryRemoteApiCall"
Process Write -> WriteToLsassProcessMemory
The third operation is Process Write. At this point in the chain, a handle has been opened and a buffer has been allocated in the remote process. Now it is time to “inject” or write the malicious shellcode to that buffer. Again, this operation requires the handle to the target process that was obtained in step one, and this time the handle must have the Process_VM_READ access right.
Upon consulting the list of ActionTypes in MDE’s DeviceEvents table, we find the WriteToLsassProcessMemory ActionType. This event is technically aligned to the Process Write operation, but unfortunately the scope is a bit narrower than we might hope for.
Note: This event used to be called WriteProcessMemoryApiCall; however, in February 2021, Microsoft renamed it based on consumer feedback so the event name more closely represents the filtering conditions that are present.
While MDE’s WriteToLsassProcessMemory ActionType is limited to Process Write operations where the target process is lsass.exe, the underlying mechanism used to produce these events provides greater coverage. According to Jonny’s Telemetry Source project, these events are generated by the Microsoft-Windows-Threat-Intelligence ETW provider. Any EDR can subscribe to this provider, so long as they meet some criteria Microsoft put forth, and those vendors can make their own filtering decisions. In general, the ETW provider is situated to identify local Process Writes (Windows Event ID 12) and remote Process Writes (Windows Event ID 14). In the context of Process Injection, we are more interested in the latter.
DeviceEvents |
where ActionType == "WriteToLsassProcessMemory"
Thread Create -> CreateRemoteThreadApiCall
The final operation is the Thread Create operation. This step requires two essential inputs, first the handle to the target process. This handle must include the PROCESS_CREATE_THREAD, PROCESS_QUERY_INFORMATION, PROCESS_VM_OPERATION, PROCESS_VM_WRITE, and PROCESS_VM_READ access rights. Additionally, the address of the memory buffer containing the shellcode must be provided. Once this operation is performed, a new thread is created which will execute the shellcode and complete the “injection” routine.
Let’s check Olaf’s list of ActionTypes to see if we can find one related to thread creation. If you found the CreateRemoteThreadApiCall ActionType, you would be on the right track.
DeviceEvents |
where ActionType == "CreateRemoteThreadApiCall"
MDE Event/Operation Relationship
The image shown below associates MDE events with their associated operations:
Sysmon
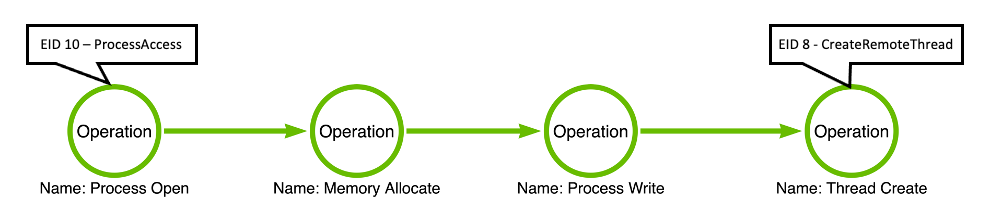
It is important to understand that each EDR is going to provide a slightly different perspective. To demonstrate this, we can turn to Sysmon: a free sensor that is available as part of the SysInternals suite of tools. While Sysmon might not qualify fully as an EDR product, telemetry production is not the feature holding it back. At the time of this writing, Sysmon provides 28 different events that can be used for detecting malicious or unauthorized activity. We can use the list of events, linked above, to begin identifying events that correspond with the operations in our operation chain. In this case, we find that Sysmon, unlike MDE, does not supply a corresponding event for EACH operation in the chain. Instead, we find that Sysmon Event ID 8, CreateRemoteThread, corresponds with the Thread Create operation and Sysmon Event ID 10, ProcessAccess, corresponds with the Process Open operation.
Sysmon Event/Operation Relationship
When it comes to Sysmon, we find that the claim that events align to operations remains true; however, we also find that not all sensors support telemetry generation for all operations. Unlike MDE, Sysmon currently only supports the Process Open and Thread Create operations. An interesting feature difference between Sysmon and MDE is that while Sysmon does not have events for the Memory Allocate and Process Write operations, it does allow for customized configuration regarding filtering for the events it does collect. This means that the user can select the conditions by which Sysmon will capture and log the relevant operations discussed above. As a result, there is a lower likelihood that a relevant event will be missed as a result of transparent filtering.
Conclusion
When it comes to detection engineering, I follow two mantras. First, “we cannot detect that which we do not understand;” this means that our ability to detect an action is dependent upon our understanding of the action itself. If we have a relatively superficial understanding of Process Injection, then we are likely to be limited to detecting the WHAT instead of the HOW. So how do we develop this understanding, and at what point can we be confident that we understand the phenomenon ENOUGH to produce a sufficient solution?
The second mantra is, “we must align our conception with our perception.” The goal of this article is to demonstrate that, especially from an endpoint telemetry perspective, we see operations, so it only makes sense that we should strive to understand the behavior in the context of operations. This facilitates proper decision making when it comes to engineering detection rules.
If you find yourself building a detection analytic and you are relying on an event that is not in the corresponding operation chain, I encourage you to ask yourself whether you are building a detection for the “what” instead of the “how.” Put another way, are you detecting the tool and not the behavior? Maybe detecting the tool is your goal, that is fine, but that should be a deliberate choice.
References
- The Fruit, the Tree, and the Serpent: Why We See So Well
- What is electroreception and how do sharks use it?
- Jonathan Johnson’s Telemetry Source Project
On Detection: Tactical to Functional Series
- Understanding the Function Call Graph
- Part 1: Discovering API Function Usage through Source Code Review
- Part 2: Operations
- Part 3: Expanding the Function Call Graph
- Part 4: Compound Functions
- Part 5: Expanding the Operational Graph
- Part 6: What is a Procedure?
- Part 7: Synonyms
- Part 8: Tool Graph
On Detection: Tactical to Functional was originally published in Posts By SpecterOps Team Members on Medium, where people are continuing the conversation by highlighting and responding to this story.
*** This is a Security Bloggers Network syndicated blog from Posts By SpecterOps Team Members - Medium authored by Jared Atkinson. Read the original post at: https://posts.specterops.io/on-detection-tactical-to-functional-f37c9b0b8874?source=rss----f05f8696e3cc---4